

Middleware is an observability platform that enables you to monitor and analyze log and trace data from your Vercel deployments. This app provides a zero-code integration that automatically configures Log and Trace Drain in your Vercel account, forwarding observability data to your Middleware account.
This integration offers a robust APM solution through a unified dashboard with automatic correlation between logs and traces. Monitor all Vercel log sources across production and preview environments, set up alerts, create custom dashboards, and gain insights into performance, latency, and error rates - all without code changes.
After installation, your Vercel logs and traces automatically flow into Middleware's platform. No code changes required - simply authenticate with your Middleware account and start monitoring. All log sources are captured, including Static, Lambda, Edge, Build, External, Firewall, and Redirect logs across production and preview environments.
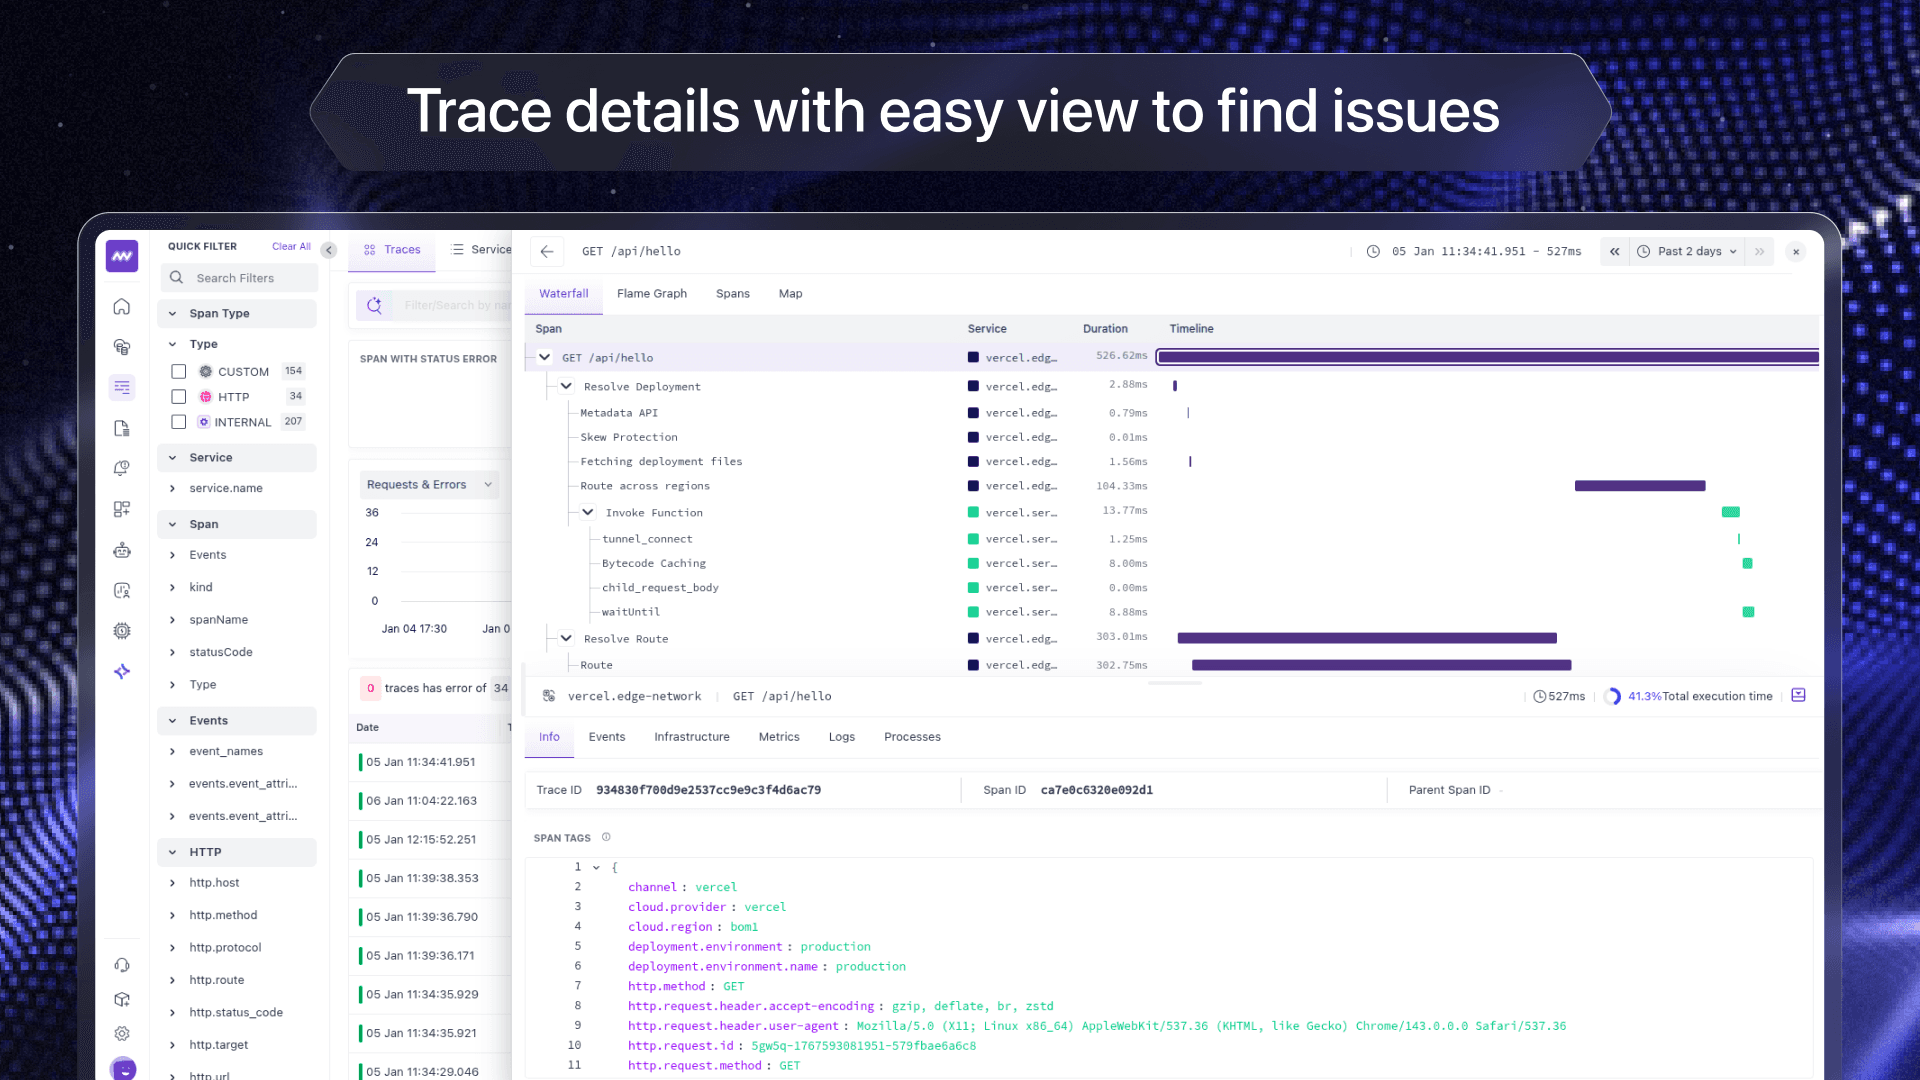
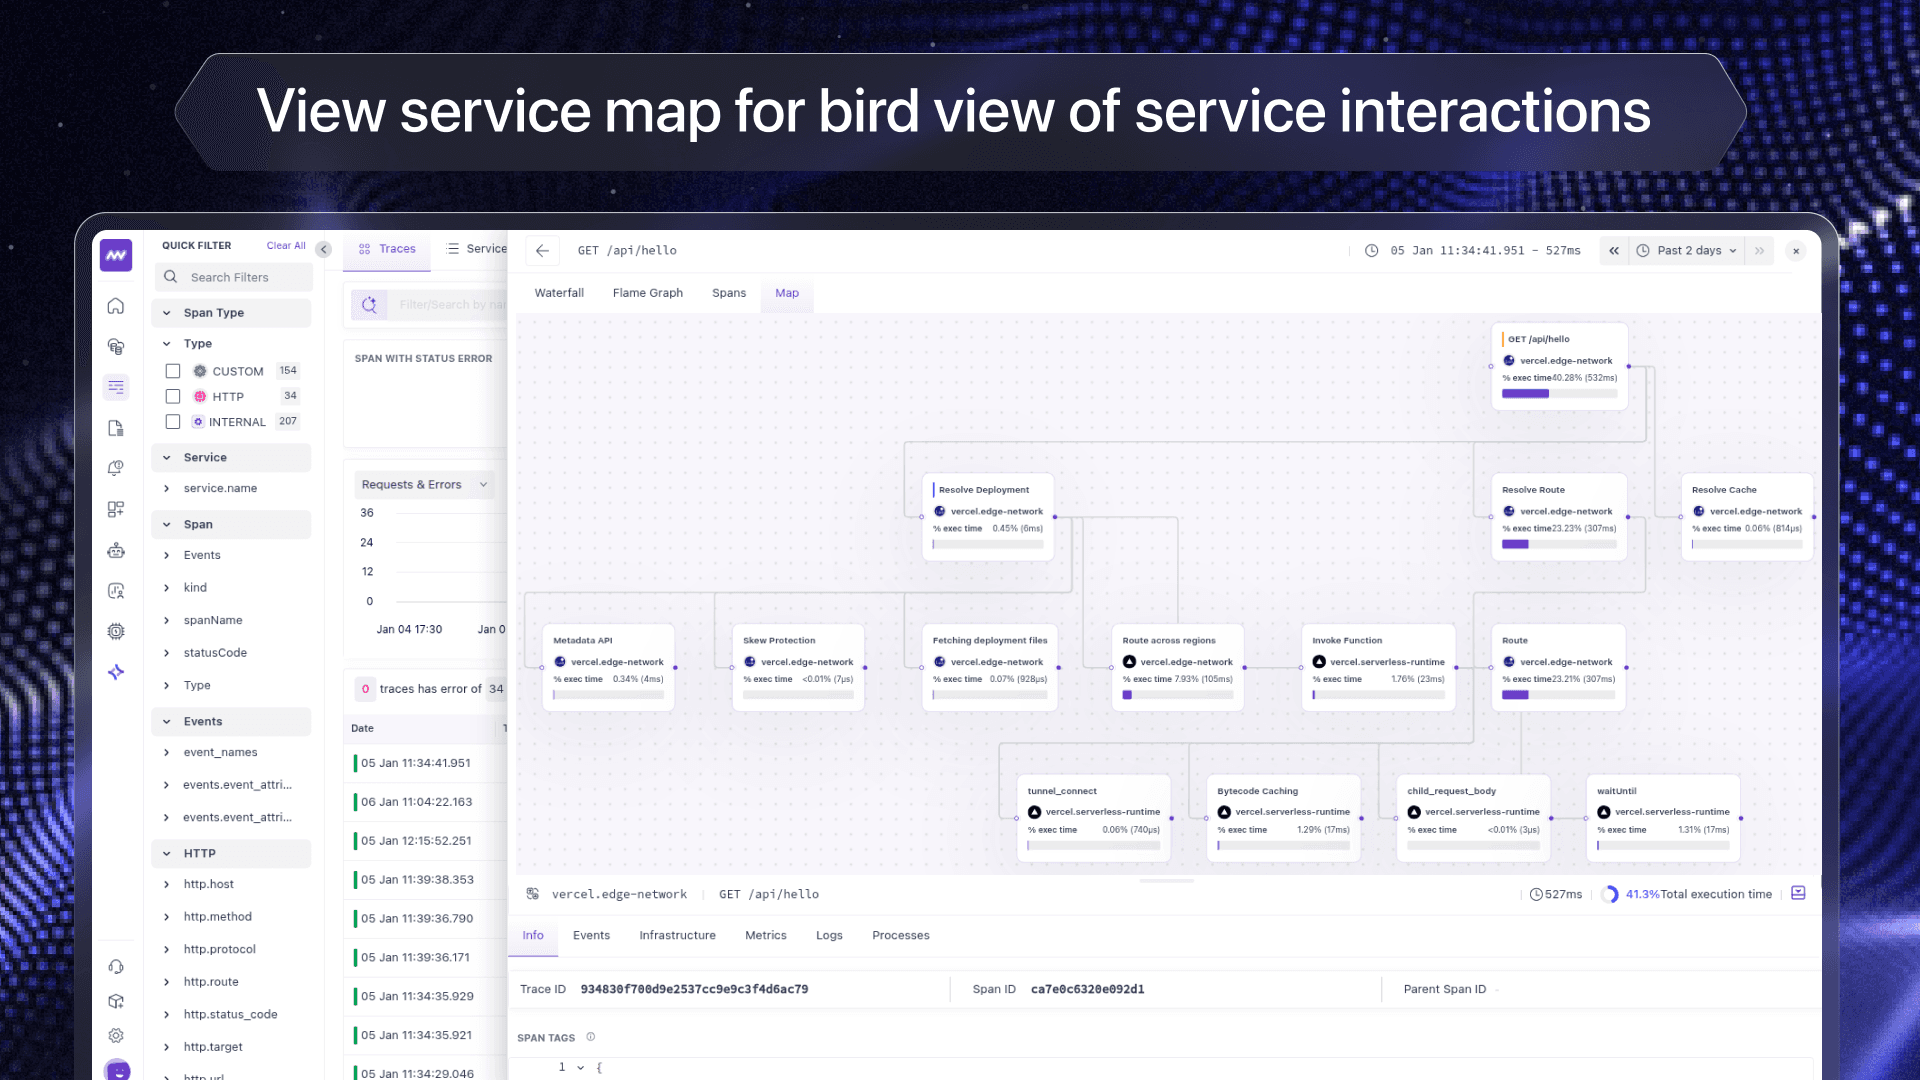
In Middleware's dashboard, view real-time log data with request counts and error rates. Filter logs by severity, source type, or environment. For traces, explore waterfall views, flame graphs, span maps, and span tables to understand request flows and identify bottlenecks. Automatic correlation via Trace ID and Span ID lets you jump from any log to its trace, or view related logs from any trace for complete debugging context.
For advanced tracing, use Vercel's @vercel/otel library to add custom spans. Refer to our Vercel integration documentation for detailed setup and configuration.
This integration requires a Pro or Enterprise plan.